Sign up to save your library
With an OverDrive account, you can save your favorite libraries for at-a-glance information about availability. Find out more about OverDrive accounts.
Find this title in Libby, the library reading app by OverDrive.


Search for a digital library with this title
Title found at these libraries:
| Loading... |
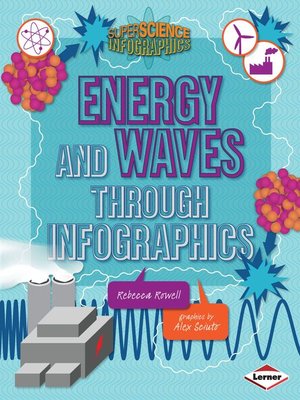
The supercharged facts about energy and waves can set your brain buzzing! You learn about huge rates of consumption (like the 35.3 quadrillion BTUs of petroleum used in the United States in 2011), huge timelines (it took 300 million years for our greatest source of energy, fossil fuels, to be created), and even huger mysteries (how long it will be before fossil fuels run out).
How can all these big numbers and concepts make more sense? Infographics! The charts, maps, and illustrations in this book tell a visual story to help you better understand key concepts about energy and waves. Crack open this book to explore mind-boggling questions such as:
The answers are sure to be shocking!


